
|
|
| |
|
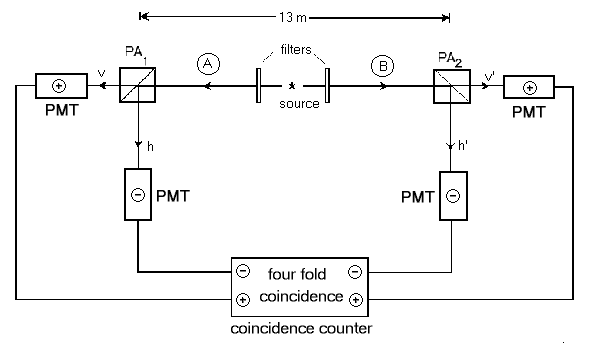
Below is a schematic diagram of the experiment in question.
1 The source consists of
excited calcium atoms which have a valence electron in the
4p2 1S0 state. Notice that the calcium
atom's valence electron has been placed into an excited state where
it has no net angular momentum (L = 0). As the atom de-excites, the
electron cascades into the 4s4p 1P1 state and
releases a green photon at 551.3 nm. This state then decays back to the
4s2 1S0 state releasing a blue photon
at 422.7 nm. Because the total angular momentum at the beginning and
end of the cascade is zero, the two photons emitted must each have
opposite angular momentum and thus the two photons must be
circularly polarized in opposite directions. The filters in
figure 1 only allow the transmission of one of the two colors.
Thus, these filters guarantee that emitted photon pairs travel to opposite
detectors such that the green photons go along path A and the blue
photons go along path B.
Before remarking on how the results are recorded at the coincidence counter, what do we expect to see? Recall that the two emitted photons are circularly polarized in opposite directions (i.e. one is rotating clockwise and the other is rotating counter-clockwise). Notice that the detectors on the "A" side and "B" side of the experiment are facing each other. So, if A sees a photons polarization as spinning clockwise, then B will see the polarization of that same photon as spinning in the opposite direction! Since we are creating photons with exactly opposite polarizations and since we are looking at these polarizations using oppositely facing filters, the two photons in this experiment should register the same polarization states and thus whichever linear component is measured on side A must also have the same value on side B. After the PMT tubes send their result to the coincidence counter, there is one more requirement which must be met before an event is recorded. One only wants to consider events which are spacelike separated. Since the polarization filters are separated by 13 meters, it would take a signal 40 ns traveling at the speed of light to go from one of the filters to the other one. To ensure that there is no communication between events which happen at the two filters, the coincidence counter only accepts results if the time delay between receiving the signals from the PMT tubes on side A and B is less than 20 ns. If the signals arrive with a time separation greater than this, the event is thrown out. If an event does occur within 20 ns, then the result from side A (either +1 or -1) is multiplied by the result from side B and an average value is found from repeated measurements. Now, given all of these measurements, how do we extract a meaningful result? In the following two sections, we will work out what we expect to see in this experiment as a function of the filter orientations a and b. Using the data, how do we derive an average value for the experiment? The definition of the expectation value (or average value) is the sum of all the resulting values times the probability for that value. So, the expectation value, as a function of the filter orientations is: E(a,b) = P++(a,b) - P+-(a,b) - P-+(a,b) + P--(a,b), where P++ is the probability that both detectors registered a "+" result, P-- is the probability that both detectors registered a "-" result, etc. These probabilities can be measured by looking at how many counts of a particular type were measured and dividing this by the total number of counts recorded. For example, P_+ would be the number of times the left detector registered a -1 at the same time as the right detector registered a +1 (by at the same time I mean within the 20ns limit meantioned above). |
